Danny Malter
VP Data Science and Machine Learning - Intellicheck
M.S. in Predictive Analytics - DePaul University

Me
Malter Analytics
GitHub
LinkedIn
YouTube Channel
Twitter
Kaggle
Other Work
General Assembly
AriBall
Media
Built In
Using AI with MLB Video to Detect Changes in Mechanics
Major League Baseball’s Statcast has done a lot to improve how player’s movements are analyzed, but little public research has been done using video and image processing to improve mechanics of players and to help prevent injuries. In part, this is due to the fact that machine learning related to images and videos requires lots of storage and high computing. Even though storage and computing are relatively cheap, there is a small cost and high complexity associated to performing data science on this type of data, which creates a barrier to entry working with it. Additionally, MLB and individual teams own video rights making accessibility of data difficult.
In this article, I will demonstrate how sample image and video data can be used in different ways to help MLB’s pitchers improve various actions, such as their mechanics, prevent future injuries, detect changes in arm movement throughout a game, as well as some other use cases. All of the concepts shown below can be used at a larger scale to make more significant impacts. Implementation of work uses a combined method of MIT’s open-source algorithm, OpenPose, as well as various data analysis and machine learning techniques. Further information about OpenPose can be seen here.
An example of the final algorithm in action is shown below.
Walker Buehler Side View
Data Capture
Data for this project was captured by collecting various video clips of a given player from both a side and center field point of view. All video and images used in this analysis are solely for a research purpose and are not being used for any team specifically. However, a team can utilize this method of analysis by having a still camera directed at a pitcher throughout a game or during a bullpen/batting practice session. For the most part, the infrastructure is already in place, so it comes down to a matter of teams collecting and utilizing this type of data. For simplicity of this analysis, a few different pitches/swings were collected for a small sample of players, but the ideal situation would be to have hundreds of pitches or swings to gain better insights from the data.
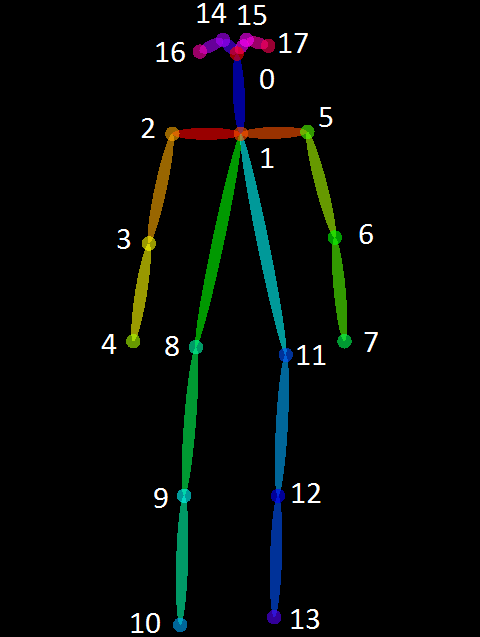
OpenPose captures data for 25 keypoints of a human body, such as “Right Wrist”, “Neck”, “Left Knee”, etc. for both still images and videos. A mapping of the keypoints to human body part can be seen in Image 1. For each image fed through the algorithm, the x-coordinates, y-coordinates and confidence (0-1) are given for each of the 25 keypoints (body parts). If the algorithm is applied to a video, then the video is essentially broken up into many separate images.
 |
|---|
| Image 1: OpenPose keypoints |
Analysis
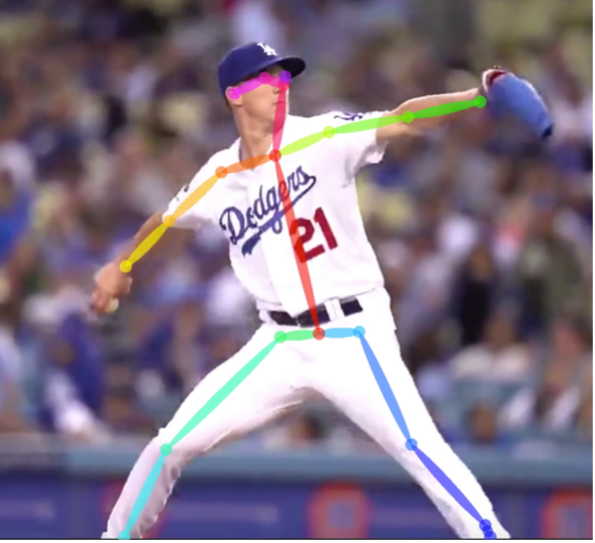
To start, we’ll look at a still image of the OpenPose algorithm applied to a side view of Walker Buehler throwing a pitch. When a keypoint cannot be found in the image, OpenPose uses machine learning to estimate where the body part is located, which is referred to as pose estimation. These cases can happen when a body part is hidden from view in the image or video. The OpenPose algorithm also works with one or multiple people in a single view, but I have found that it works best with only one person in the picture to reduce background noise. In cases where non-relevant people are in the background, image processing techniques such as blurring effects or cropping can be used to filter out this noise. This article will not focus on this the preprocessing work implemented prior to running images and video through the OpenPose algorithm, but OpenCV or deep learning techniques would be appropriate for implementing background blurring effects.
 |
|---|
| Image 2: OpenPose applied to a still image of Walker Buehler |
By feeding in a video through the OpenPose algorithm, we get an output like the video below. Here we see the OpenPose algorithm in action throughout the duration of a full pitch for Walker Buehler. During this one center field view clip, 101 snapshots were taken by the algorithm. Another way to think about this is that the video is turned into a sequence of 101 still images. This number will differ depending on the length of a particular video.
 Walker Buehler Center Field View
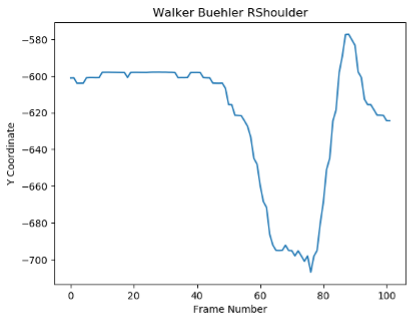
Using the output data from each of the 101 center field view images, a plot for a given keypoint (body part) can be mapped out over time. From a windup approach, the below chart shows an example of Buehler’s right shoulder movement over the duration of the pitch above. As Buehler approaches the release of the ball, his shoulder drops and then picks back up as he finishes the pitch. This is evident by simply watching the video, but the advantage of this type of analysis is that this data can pick up changes in a pitcher’s mechanics that the naked eye may not be able to see. Additionally, given the proper data, thousands of videos can be analyzed in a matter of minutes versus spending hours of film watching.
 |
|---|
| Image 3: Walker Buehler’s right shoulder mapped out over the duration of a single pitch |
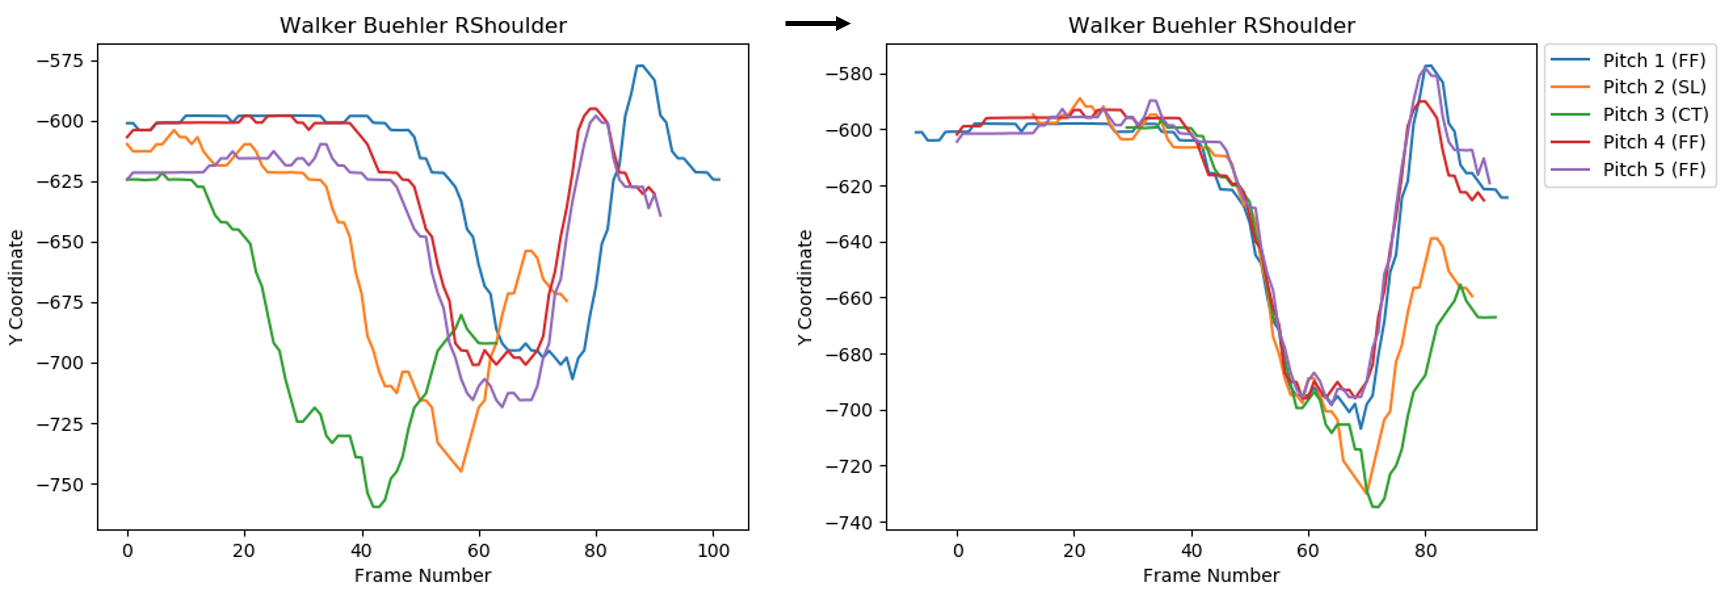
Valuable information can be shown from one unique pitch, but deeper analysis can start to be made from taking multiple pitches of the same pitcher over the duration of a game or multiple appearances. The left chart below shows an analysis from five different pitches Buehler threw over the same game. Each clip is initiated at a slightly different time prior to Buehler starting his motion, so in order to make more meaning of these five pitches, the right chart shows the same five pitches overlayed on top of each other starting from roughly the same point in time. The data shows that Buehler has a slightly different motion for his cutter and slider than for his four-seam fastball. Although not evidence, this possibly can mean that Buehler is tipping his pitches as shown in the clear change in patterns.
It is important to note here that the distance of the plot is measured in pixels, so in order to know how significant this difference really is to a batter, the pixels need to be converted into inches. With technology such as MLB’s Statcast, this should not be an issue implementing into gameday data. In this example, based on an estimated PPI (pixels per inch) of 250px, it’s estimated that difference in shoulder height distance between Buehler’s four-seam fastball versus his cutter and slider is about 0.25 inches.
 |
|---|
| Image 4: Walker Buehler’s right shoulder mapped out over the duration for five distinct pitches |
Future Implementation
There are lots of opportunities for further research still to be done in this area, but the difficulty is having the appropriate input data. Some options would be for MLB to release video clips of this type for research purposes or to implement this data into MLB’s open-source data as it’s own standalone data source. Another option would be to work with teams or individual players to collect video footage during offseason training. In regards for use cases of this data, here are a few ideas.
Player Scouting:
- OpenPose can be used to measure how closely one player’s pitching or hitting mechanics are relative to another known player. By collecting data like angles of body parts, movement, etc., clustering algorithms can be used to measure the similarity between two player’s pitches or swings. From a scouting perspective, these types of models can output something along the lines of, “Player A’s swing is 80% similar to Mike Trout”.
Tracking Mechanics:
- Rather than a player or coach going through video one by one, OpenPose technology can be used to better align hundreds or thousands of videos all at once. If a pitcher is unknowingly changing their mechanics, data from OpenPose can be mapped out with a time dimension, similar to the charts used for Buehler, to determine how much of a change is occurring and which body part is causing mechanics to differ.
Injury Prevention:
-
By using this type of pitcher or batter tracking data, models like outlier detection algorithms can be used to detect if a pitcher’s mechanics are differing too much from the norm. If an outlier is detected, an alert system can be programmed to provide information to the pitcher that a significant change in their mechanics was detected and this hopefully would help to prevent a future injury.
-
This type of data can also be used to measure a given pitcher’s mechanics to those that have previously suffered from pitching related injuries. For example, let’s say that Pitcher A suffered from Tommy John surgery. At the start of the season, Pitcher A and Pitcher B start out with a 60% similarity in pitching mechanics. However, by the end of the season, Pitcher B’s mechanics are off and now the similarity between the two pitchers is at 90%. Perhaps this would be a red flag for Pitcher B to investigate further so that he too does not ultimately suffer from Tommy John.
Whether it be pitchers like Trevor Bauer filming their practice sessions in the off-season, batters trying to gain an advantage, or simply just trying to prevent injuries, there are lots of use cases for this type of data. Time will tell if MLB provides this data in more readily available formats, but there is no doubt that teams can already start utilizing this type of data if they aren’t already.
Example code to run the OpenPose algorithm be seen here. This example code excludes data cleaning, preprocessing and analyzing of data.
comments powered by Disqus