Danny Malter
VP Data Science and Machine Learning - Intellicheck
M.S. in Predictive Analytics - DePaul University

Me
Malter Analytics
GitHub
LinkedIn
YouTube Channel
Kaggle
Other Work
Into to Python Course
General Assembly
AriBall
Media
Built In
Twitter Sentiment of MLB Teams
Introduction
In this tutorial, I have scraped Twitter data for all 30 major league baseball teams and have given the tweet a positve or negative rating based off of Hu & Liu’s opinion lexicon. For example, a tweet with 5 positve words and 3 negative words will be given a sentiment score of +2. Each team is searched for in Twitter by using a hashtag followed by the team name. Teams with common names or with the same name as a team from another sport were included with the addition of the word ‘mlb’. For this analysis, 1,500 tweets were scraped for each team.
Although the season is nearly two weeks over, playoff teams tend to have a higher positive rating than non-playoff teams. The Royals, which were searched for by using both ‘#royals’ and ‘mlb’ in order to eliminate any common tweets with the word ‘royals’, are heavily weighted with positive tweets. After reading through tweets about the Royals, there seems to be a lot of optimism already about free agency and the 2015 season.
Teams with more negative tweets may have had a player reject an offer for next year. For example, while running the code, reports came out that Francisco Liriano rejected an offer from the Pirates, which stirred up some negative backlash and negative words in tweets that contained ‘#pirates’. Another example is with the Dodgers, which have a negative trend because there were reports that Hanley Ramirez rejected an offer previous to me running the code.
Loading and Processing
Install/load R packages
library(devtools)
install_github("twitteR", username="geoffjentry")
library(twitteR)
library(rjson)
library(httr)
library(stringr)
library(ggplot2)
library(RColorBrewer)
library(plyr)
library(bit64)
Access Twitter’s API
api_key <- "####"
api_secret <- "####"
access_token <- "####"
access_token_secret <- "####"
setup_twitter_oauth(api_key,api_secret,access_token,access_token_secret)
Data Processing
Load in Hu & Liu’s opinion lexicon of positive and negative words.
pos.words <- scan('/Users/Malter/Twitter/positive-words.txt', what='character', comment.char=';')
neg.words <- scan('/Users/Malter/Twitter/negative-words.txt', what='character', comment.char=';')
Twitter Score Sentiment To give a sentiment score to each tweet, I used a scoring sentiment function created by Jeff Breen.
score.sentiment = function(sentences, pos.words, neg.words, .progress='none')
{
    require(plyr)
    require(stringr)
    scores = laply(sentences, function(sentence, pos.words, neg.words) {
        sentence = gsub('[[:punct:]]', '', sentence)
        sentence = gsub('[[:cntrl:]]', '', sentence)
        sentence = gsub('\\d+', '', sentence)
        sentence = tolower(sentence)
        word.list = str_split(sentence, '\\s+')
        words = unlist(word.list)
        pos.matches = match(words, pos.words)
        neg.matches = match(words, neg.words)
        pos.matches = !is.na(pos.matches)
        neg.matches = !is.na(neg.matches)
        score = sum(pos.matches) - sum(neg.matches)
        return(score)
    }, pos.words, neg.words, .progress=.progress )
    scores.df = data.frame(score=scores, text=sentences)
    return(scores.df)
}
I then want to scrape Twitter for each MLB team using the team’s official hashtag. Team names that coincide with other sports or common terms were included with an @ rather than a # to include the teams official Twitter handle.
- Example code for AL East
orioles.tweets <- searchTwitter('#orioles', n=500, lang="en")
yankees.tweets <- searchTwitter('#yankees', n=500, lang="en")
bluejays.tweets <- searchTwitter('#bluejays', n=500, lang="en")
rays.tweets <- searchTwitter('#rays', n=500, lang="en")
redsox.tweets <- searchTwitter('#redsox', n=500, lang="en")
Create an array of the output text for each division.
- Example code for AL East
orioles.text = laply(orioles.tweets, function(t) t$getText())
yankees.text = laply(yankees.tweets, function(t) t$getText())
bluejays.text = laply(bluejays.tweets, function(t) t$getText())
rays.text = laply(rays.tweets, function(t) t$getText())
redsox.text = laply(redsox.tweets, function(t) t$getText())
Strip out funny characters, such as emoticons.
- Example code for AL East
orioles.text = gsub("[^[:alnum:]|^[:space:]]", "", orioles.text)
yankees.text = gsub("[^[:alnum:]|^[:space:]]", "", yankees.text)
bluejays.text = gsub("[^[:alnum:]|^[:space:]]", "", bluejays.text)
rays.text = gsub("[^[:alnum:]|^[:space:]]", "", rays.text)
redsox.text = gsub("[^[:alnum:]|^[:space:]]", "", redsox.text)
Use the above scoring function to give a score to each team’s tweet recorded.
orioles.scores <- score.sentiment(orioles.text, pos.words,
                                   neg.words, .progress='text')
yankees.scores <- score.sentiment(yankees.text, pos.words,
                                   neg.words, .progress='text')
bluejays.scores <- score.sentiment(bluejays.text, pos.words,
                                   neg.words, .progress='text')
rays.scores <- score.sentiment(rays.text, pos.words,
                                   neg.words, .progress='text')
redsox.scores <- score.sentiment(redsox.text, pos.words,
                                   neg.words, .progress='text')
Give a name and code to each team.
- Example code for AL East
orioles.scores$team = 'Orioles'
orioles.scores$code = 'BAL'
yankees.scores$team = 'Yankees'
yankees.scores$code = 'NYA'
bluejays.scores$team = 'Blue Jays'
bluejays.scores$code = 'TOR'
rays.scores$team = 'Rays'
rays.scores$code = 'TBA'
redsox.scores$team = 'Red Sox'
redsox.scores$code = 'BOS'
Use rbind to combine tweets from each division in order to later graph by divisions.
aleast.scores = rbind(orioles.scores, yankees.scores, bluejays.scores, rays.scores, redsox.scores)
alcentral.scores = rbind(whitesox.scores, tigers.scores, twins.scores, royals.scores, indians.scores)
alwest.scores = rbind(angels.scores, athletics.scores, mariners.scores, astros.scores, rangers.scores)
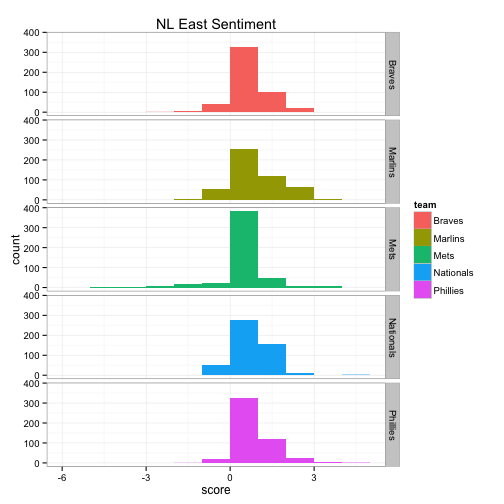
nleast.scores = rbind(nationals.scores, mets.scores, braves.scores, marlins.scores, phillies.scores)
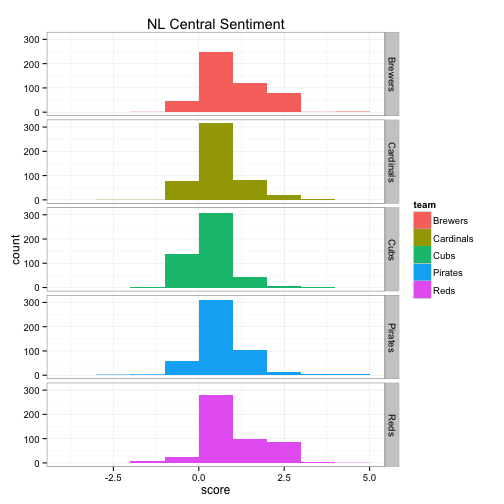
nlcentral.scores = rbind(cardinals.scores, pirates.scores, brewers.scores, reds.scores, cubs.scores)
nlwest.scores = rbind(dodgers.scores, giants.scores, padres.scores, rockies.scores, diamondbacks.scores)
Results
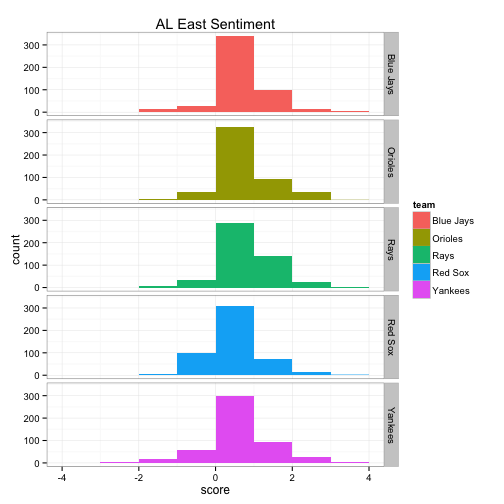
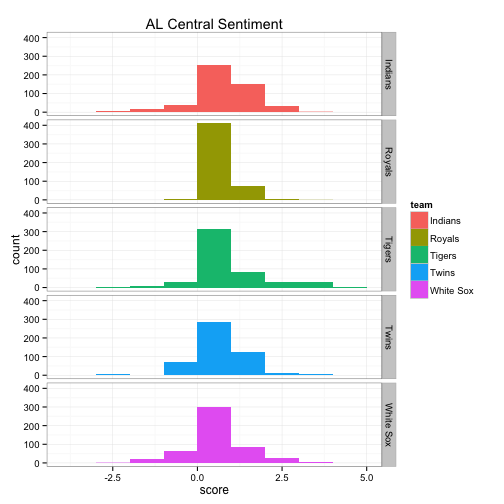
The top 6 bar graphs show the count of tweets for each team on the y-axis and the Twitter sentiment score on the x-axis, broken down by division. For example, the Blue Jays had roughly 800 of the 1500 tweets with a sentiment score of 0, about 500 with a sentiment score of +1, about 50 of the tweets had a sentiment score of +2 and so on.
- Example code for AL East
ggplot(data=aleast.scores) +
    geom_bar(mapping=aes(x=score, fill=team), binwidth=1) +
    facet_grid(team~.) +
    theme_bw() + scale_color_brewer() +
    labs(title="AL East Sentiment")


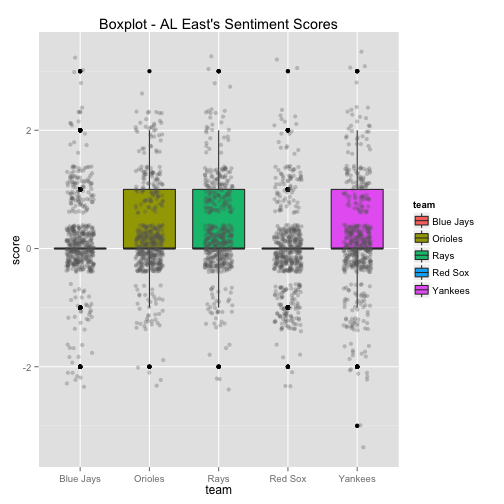
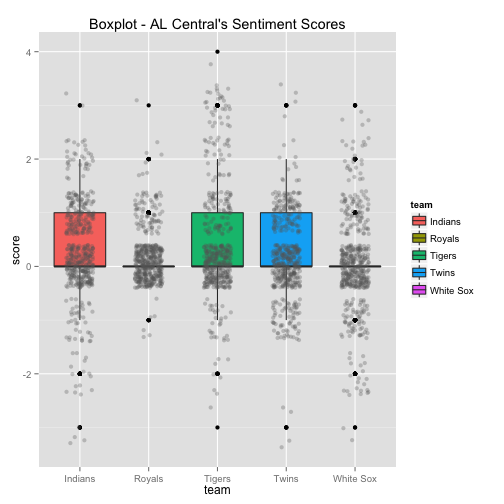
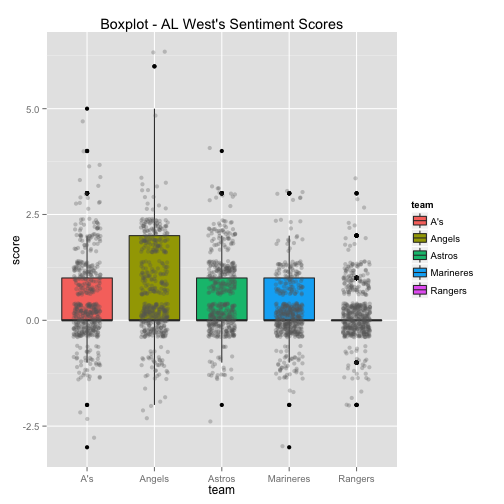
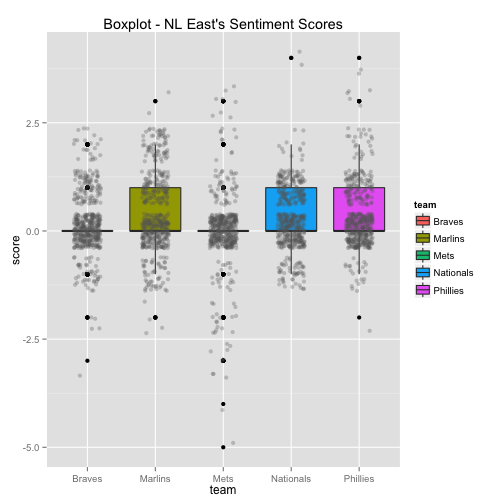
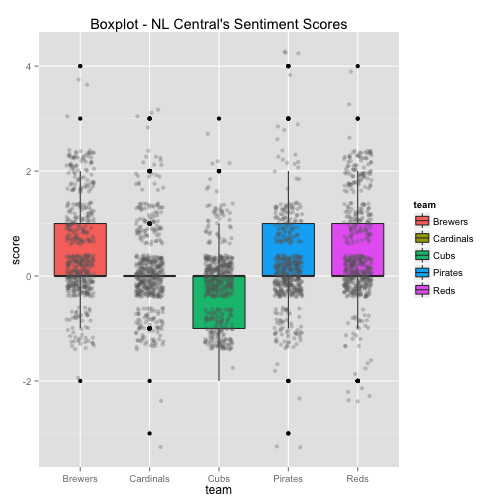
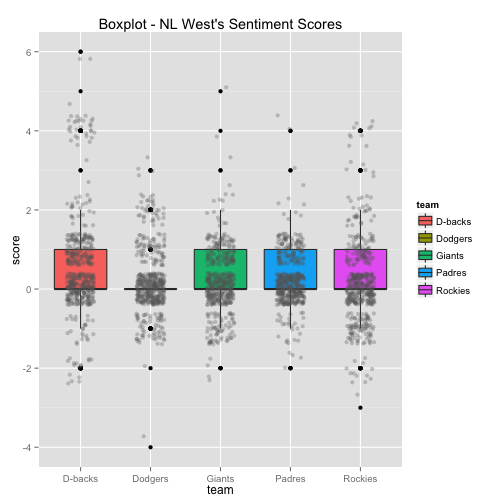
The bottom 6 box plots have the team’s Twitter sentiment score on the y-axis and the team name on the x-axis. There are 1,500 dots for each team with each dot representing the score given for each tweet. The larger the height of the box plot, the larger the distribution between positive and negative tweets.
- Example code for AL East
ggplot(aleast.scores, aes(x=team, y=score, group=team)) +
    geom_boxplot(aes(fill=team)) +
    geom_jitter(color="gray40",
                position=position_jitter(width=0.2), alpha=0.3) +
    ggtitle("Boxplot - AL East's Sentiment Scores")